
Don’t say NO Before you Try it !
Today, i want to share about my experience about get data from database and show to Bar Chart Android. I guess this is quite difficult because i have searched in stack overflow, android developer facebook group, youtube and asked to several groups and my developer friends, but it was so hard to get it. That tutorial like one in the blue month. :)
Finally, i got one link and it make me can solve this problem. #ayeee :D
You can access here
You can access here
Now, i will give step by step how to create bar chart and retrieve data from database :
- Make data json, in this part i have data json like this :
{
“result”: “true”,
“msg”: “Data Indikator”,
“data”: [
{
“id_indikator”: “35”,
“id_tipe_indikator”: “1”,
“th_indikator”: “2012”,
“jml_indikator”: “16.43”,
“id”: “1”,
“tipe_indikator”: “Pertumbuhan Ekonomi”
},
{
“id_indikator”: “36”,
“id_tipe_indikator”: “1”,
“th_indikator”: “2013”,
“jml_indikator”: “-8.16”,
“id”: “1”,
“tipe_indikator”: “Pertumbuhan Ekonomi”
},
{
“id_indikator”: “37”,
“id_tipe_indikator”: “1”,
“th_indikator”: “2014”,
“jml_indikator”: “0.48”,
“id”: “1”,
“tipe_indikator”: “Pertumbuhan Ekonomi”
},
{
“id_indikator”: “38”,
“id_tipe_indikator”: “1”,
“th_indikator”: “2015”,
“jml_indikator”: “7.65”,
“id”: “1”,
“tipe_indikator”: “Pertumbuhan Ekonomi”
},
{
“id_indikator”: “39”,
“id_tipe_indikator”: “1”,
“th_indikator”: “2016”,
“jml_indikator”: “3.74”,
“id”: “1”,
“tipe_indikator”: “Pertumbuhan Ekonomi”
}
]
}
2. And then in android, i put several depencies or libraries
- retrofit for retrieve data from database, we can you method post , get and others
implementation 'com.squareup.retrofit2:retrofit:2.3.0'
- MPAndoidchart, so far this is awesome library :* we can build various chart, example barchart, LineChart (with legend, simple design), LineChart (with legend, simple design), LineChart (cubic lines), Horizontal-BarChart, RadarChart (spider web chart) and many others
compile 'com.github.PhilJay:MPAndroidChart:v2.0.9'
3. in design layout android, make design like this
<?xml version="1.0" encoding="utf-8"?><android.support.constraint.ConstraintLayout xmlns:android="http://schemas.android.com/apk/res/android"
    xmlns:app="http://schemas.android.com/apk/res-auto"
    xmlns:tools="http://schemas.android.com/tools"
    android:layout_width="match_parent"
    android:layout_height="match_parent"
    tools:context="imastudio.id.co.androidcharexample.MainActivity">

    <RelativeLayout
        android:layout_width="match_parent"
        android:layout_height="match_parent">
        <com.github.mikephil.charting.charts.BarChart
            android:id="@+id/chart"
            android:layout_width="match_parent"
            android:layout_height="match_parent" />

    </RelativeLayout>
</android.support.constraint.ConstraintLayout>

4. In Activity, to get data json using retrofit we add code :
private void getListData() {
        try {
            RestApi api = MyRetrofitClient.getInstanceRetrofit2();


            Call<RssJ544IndikatorByTipe> call = api.getIndikatorByTipe(idTipe);
            call.enqueue(new Callback<RssJ544IndikatorByTipe>() {
                @Override
                public void onResponse(Call<RssJ544IndikatorByTipe> call, Response<RssJ544IndikatorByTipe> response) {
//                    Log.d("onResponse", response.body().toString());

                    String r = response.body().getResult();
                    Log.d("adaa22", response.body().toString());

                    if (r.equalsIgnoreCase("true")) {


                        dataIndikator = response.body().getData();

                        ArrayList<BarEntry> yVals = new ArrayList<BarEntry>();


                        for (int i = 0; i < dataIndikator.size(); i++) {
                            DataItemJ554IndikatorByTipe x = dataIndikator.get(i);
                            float a12 = Float.parseFloat(x.getJmlIndikator());
                            int a22 = Integer.parseInt(x.getId());
                            yVals.add(new BarEntry(Float.parseFloat(dataIndikator.get(i).getJmlIndikator()), i));
                        }


                        ArrayList<String> xVals = new ArrayList<String>();
                        for (int i = 0; i < dataIndikator.size(); i++) {
                            DataItemJ554IndikatorByTipe x = dataIndikator.get(i);
                            float a12 = Float.parseFloat(x.getJmlIndikator());
                            String a22 = x.getIdIndikator();
                            xVals.add(a22);

                        }

                        BarDataSet dataSet = new BarDataSet(yVals, dataIndikator.get(0).getTipeIndikator());
                        dataSet.setColors(ColorTemplate.COLORFUL_COLORS);

                        BarData data = new BarData(xVals, dataSet);


                        LimitLine line = new LimitLine(12f, dataIndikator.get(0).getTipeIndikator());
                        line.setTextSize(12f);
                        line.setLineWidth(4f);
                        YAxis leftAxis = chart.getAxisLeft();
                        leftAxis.addLimitLine(line);

                        chart.setData(data);
                        chart.setDescription(dataIndikator.get(0).getTipeIndikator());
                        chart.animateY(2000);


                    } else {

                    }


                }

                @Override
                public void onFailure(Call<RssJ544IndikatorByTipe> call, Throwable t) {

                }
            });

//
        } catch (Exception e) {
        }
    }
Full code in activity :
public class MainBarChart extends AppCompatActivity {

     public static List<DataItemJ554IndikatorByTipe> dataIndikator;


    DataItemJ54GetAllIndikator dataItemGet;
    String idTipe;
    BarChart chart;

    int start, end;


    @Override
    protected void onCreate(Bundle savedInstanceState) {
        super.onCreate(savedInstanceState);
        setContentView(R.layout.activity_main);
        chart = (BarChart) findViewById(R.id.chart);

        dataIndikator = new ArrayList<>();


        int posisi = getIntent().getIntExtra("posisi", 0);

        dataItemGet = MenuTipeIndikatorActivity.dataItemJ23RiwayatLelangs.get(posisi);

        idTipe = dataItemGet.getId();
        Toast.makeText(getApplicationContext(), "id " + idTipe, Toast.LENGTH_LONG).show();


        getListData();

    }

    private void getListData() {
        try {
            RestApi api = MyRetrofitClient.getInstanceRetrofit2();


            Call<RssJ544IndikatorByTipe> call = api.getIndikatorByTipe(idTipe);
            call.enqueue(new Callback<RssJ544IndikatorByTipe>() {
                @Override
                public void onResponse(Call<RssJ544IndikatorByTipe> call, Response<RssJ544IndikatorByTipe> response) {
//                    Log.d("onResponse", response.body().toString());

                    String r = response.body().getResult();
                    Log.d("adaa22", response.body().toString());

                    if (r.equalsIgnoreCase("true")) {


                        dataIndikator = response.body().getData();

                        ArrayList<BarEntry> yVals = new ArrayList<BarEntry>();


                        for (int i = 0; i < dataIndikator.size(); i++) {
                            DataItemJ554IndikatorByTipe x = dataIndikator.get(i);
                            float a12 = Float.parseFloat(x.getJmlIndikator());
                            int a22 = Integer.parseInt(x.getId());
                            yVals.add(new BarEntry(Float.parseFloat(dataIndikator.get(i).getJmlIndikator()), i));
                        }


                        ArrayList<String> xVals = new ArrayList<String>();
                        for (int i = 0; i < dataIndikator.size(); i++) {
                            DataItemJ554IndikatorByTipe x = dataIndikator.get(i);
                            float a12 = Float.parseFloat(x.getJmlIndikator());
                            String a22 = x.getIdIndikator();
                            xVals.add(a22);

                        }

                        BarDataSet dataSet = new BarDataSet(yVals, dataIndikator.get(0).getTipeIndikator());
                        dataSet.setColors(ColorTemplate.COLORFUL_COLORS);

                        BarData data = new BarData(xVals, dataSet);


                        LimitLine line = new LimitLine(12f, dataIndikator.get(0).getTipeIndikator());
                        line.setTextSize(12f);
                        line.setLineWidth(4f);
                        YAxis leftAxis = chart.getAxisLeft();
                        leftAxis.addLimitLine(line);

                        chart.setData(data);
                        chart.setDescription(dataIndikator.get(0).getTipeIndikator());
                        chart.animateY(2000);


                    } else {

                    }


                }

                @Override
                public void onFailure(Call<RssJ544IndikatorByTipe> call, Throwable t) {

                }
            });

//
        } catch (Exception e) {
        }
    }
}
5. Run application and we can see the result :
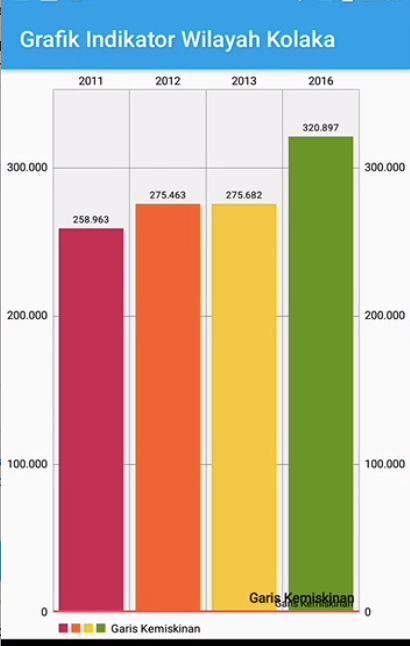
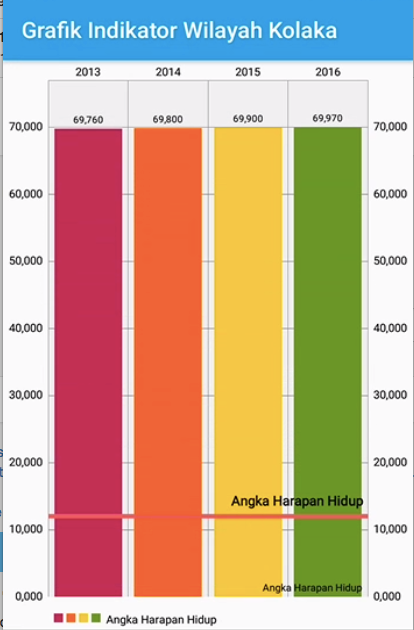

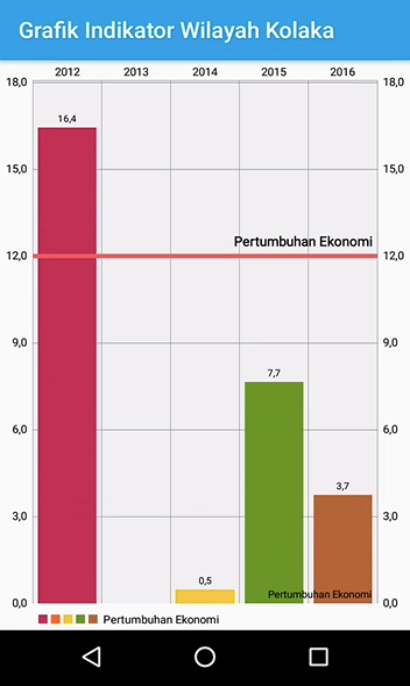
Demo :
Download project from github
Last, I want to say Alhamdulillah and Don’t forget leave your feedback and comment :)
Thanks

Comments
Post a Comment