https://www.javahelps.com/2015/11/wso2-cep-hello-world.html
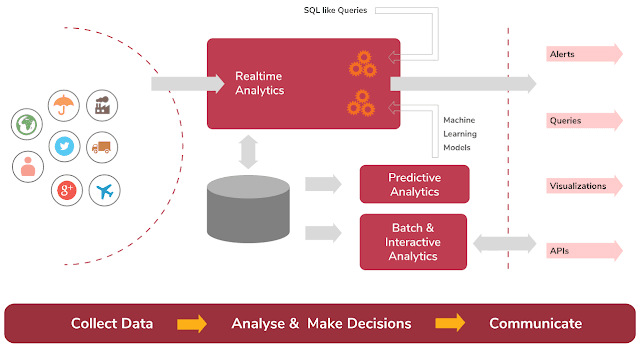
WSO2 Data Analytics Server is a smart analytics platform for both real-time and batch analytics. The real-time analytics is provided through their powerful open source Complex Event Processing Engine engine Siddhi. This article focuses on the complex event processing capability of the DAS server and provides a quick start guide on how to setup an event stream and process events generated by an HTTP source.
Prerequisite:
Oracle JDK 1.7 or latest
Memory – Minimum 2GB
Disk – Minimum 1 GB
For more details: Installation PrerequisitesStep 1:
Download and extract the latest version of WSO2 DAS from the official link: WSO2 Smart Analytics
Step 2:
Install Postman in Google chrome. We will use Postman to send HTTP requests to the CEP. You can use any other HTTP clients for this purpose.
Step 3:
Open your terminal in wso2das-x.x.x folder and execute the following command.
Linux users:
./bin/wso2server.shWindows users:
.\bin\wso2server.batStep 4:
Visit the "Mgt Console URL" which is printed in the Terminal. In my computer, this URL is: https://192.168.122.1:9443/carbon/ but it may vary depending on the system.
The browser may show an alert since the local server does not contain a valid HTTPS certificate, click on 'Proceed to <IP-Address>' link.
Login to the dashboard using username: admin and password: admin.
Step 6:
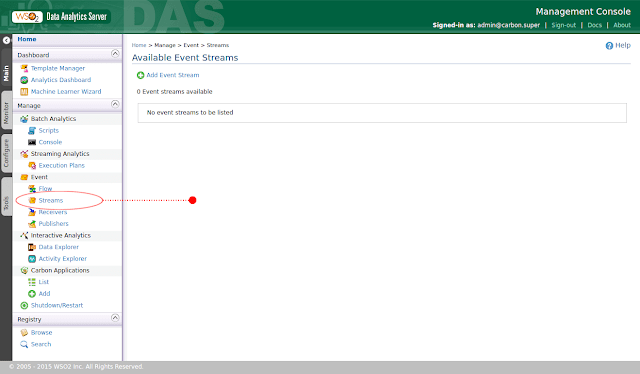
Go to the Streams tab and click on “Add Event Stream” link.
Step 7:
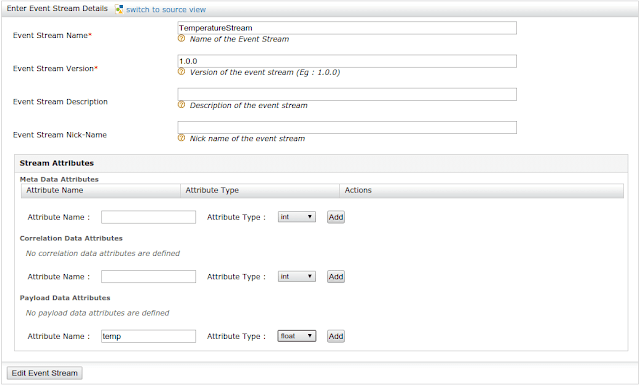
Provide the stream name as “TemperatureStream” and add a payload attribute “temp” as shown below.
Step 8:
Add another stream named “PeakTemperatureStream” with a payload data “temp”.
Step 9:
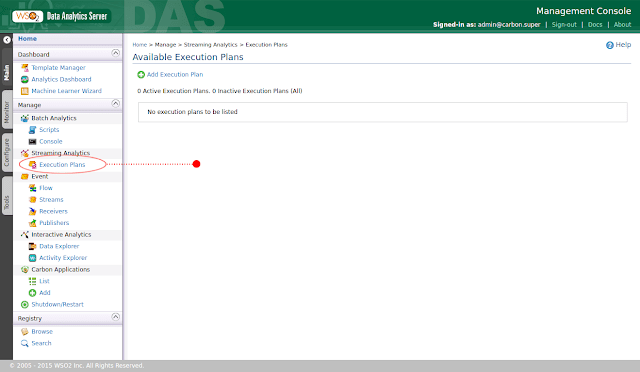
Open the “Execution Plans” tab and click on “Add Execution Plan” link.
Step 10:
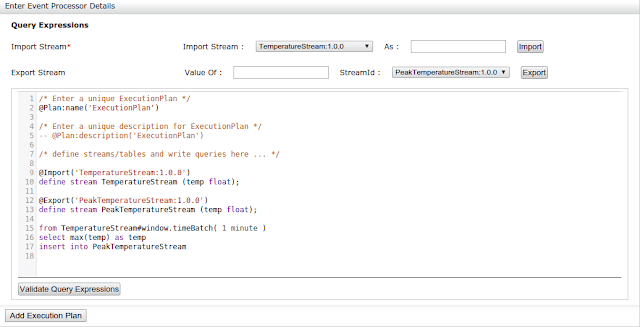
Import the TemperatureStream and Export the PeakTemperatureStream using their own names.
Step 11:
Append the following query at the end of the existing query statements.
from TemperatureStream#window.timeBatch( 1 minute )
select max(temp) as temp
insert into PeakTemperatureStream
This query will collect the events from TemeratureStream and insert the maximum temperature of every minute into the PeakTemperatureStream.
Validate your query expressions and add the execution plan.
Step 12:
Go to the “Receivers” tab and click on the “Add Event Receiver” link.
Step 13:
Create a new HTTP event receiver to receive the TemperatureStream with a name “TemperatureReceiver” and format “json”.
This receiver will receive HTTP requests and pass the event details to the TemperatureStream.
Step 14:
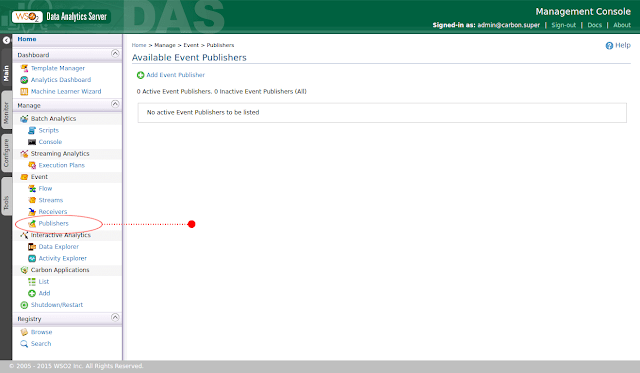
Now we need to create a publisher to publish the peak temperature. Go to the “Publishers” tab and click on the “Add Event Publisher” link.
Step 15:
Create a new logger event publisher for PeakTemperatureStream with a name “TemperaturePublisher”.
This publisher will print the events inserted into the PeakTemperatureStream using the built-in logger.
Step 16:
Now we have two event streams, an event receiver, an executor and a publisher. In Siddhi you can have multiple receivers and publishers for the same stream. Now this the time to send some events and to test the CEP engine.
Open the Postman and send few POST HTTP requests to:
http://localhost:9763/endpoints/TemperatureReceiver
with the TemperatureStream event as a JSON message. Send few numbers of requests with different temperatures.JSON input:
{
    "event": {
        "payloadData": {
            "temp": 15.6
        }
    }
}
Step 17:
Go the Terminal which is running the wso2server. At the bottom, you will see the maximum temperature value you have sent within the last minute.
Note:
The query used here and the event publisher to the logger are chosen to simplify your first step. You have the freedom to try other event receivers and publishers according to your requirement.
If you have any doubts or problems regarding this article, feel free to comment below.
If you have any doubts or problems regarding this article, feel free to comment below.







Comments
Post a Comment